To celebrate the 50 years anniversary of the Dauphine Recherche en Management lab, we produced a graph visualization of the researchers who were involved in DRM theses and their interactions.
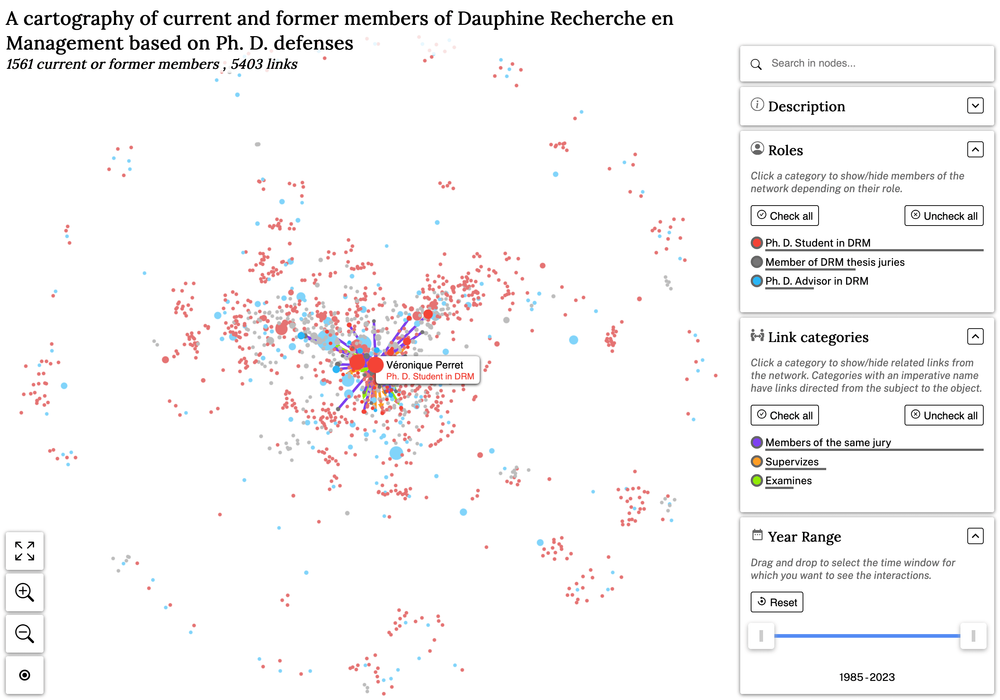
The visualization represents a network of Ph. D. students, Ph. D. advisors and jury members from the DRM research lab. Each node represents a researcher and each edge represents a thesis supervision, a thesis examination, or a co-occurrence of two researchers in a jury. Jury members are included even if they have not done their Ph. D. with DRM or supervized a DRM thesis, but only if they took part in at least 2 DRM-related juries.
The goal of this vizualization is to offer a map of the interactions between DRM researchers where the research communities are easily identifiable through node proximity. The visualization also allows you to search for a name directly, or to apply filters if you are only interested in a sub-network. For example, you can look for:
- Researchers involved in DRM theses, but not only as jury members, between 2010 and 2020;
- Ph. D. students and the members of their juries after 1993;
- etc.
The data was enriched using open data from Theses.fr and IdRef. Due to a lack of data on older theses, the jury members are not available for many theses before 2011.
The visualization is available here and if you are curious about the code, you can also find it here.